R for Sutta Science

Hey Folks,

Seems like there’s at least one or two people playing with R. I’d suggest sharing any ideas here on this thread. @chaz has already experimented with the tidytext package.

Some ideas:

  • Visualisation - some of the world’s best graphics, from magazines to scientific papers are made using R.
  • Modeling & statistics - If you’re looking for a PhD thesis, this would be breaking new ground. Otherwise, modeling is fun and much more accessible now that computational techniques have been turned into easy-to-use APIs.
  • Mining - SuttaCentral is great if you already know the cannon well. However, there are certainly many hidden gems in the texts that few people know about.
  • Index creation - Bhikkhu Bodhi has already added proper names and subjects to the indexes of his translations. Many other aspects of the suttas could have the same treatment applied.
  • Machine Learning - create an algorithm that takes a text and classifies it as Dhamma or Not-Dhamma. Ok, we’ll call that a stretch goal.

Have fun!

7 Likes

For those, like me, who had no idea what the venerable was talking about,

https://www.r-project.org/

And from Wikipedia:

1 Like

Don’t worry, that happens a lot.

R and the associated ecosystem of tools goes beyond programming and into the realm of science and research. For instance, if you’re an ecologist working with data on cricket chirps you may wish to use R to visualise and explore that data without knowing a lot about computer science or software engineering. Often a researcher will work with a very small subset of the language and a few of their favorite tools.

Why approach the texts in the same way? For me personally, it’s a bit of fun that might turn out yield interesting, perhaps even useful, insights.

If you have any more questions about R, please ask away!

3 Likes

So @chaz - I’ve not had a chance to look at tidytext yet. As Julia Silge co-wrote it, I’ve got high hopes! As I haven’t been involved with SC development for several years, I don’t know much about it’s current architecture. What did you manage to extract, and how?

Hi Ven @Jhanarato just responding to what you mentioned in the original thread - I’m a rank amateur as well so that’s good to know! And yes I was trying to build a dataset myself and because I couldn’t find a way to generate it programatically I was having to binge-read the MN so I know what you mean!

Anyway, I created a repo here with the two scripts I wrote to load and clean the data, and the two .Rda files that they produced. Unfortunately you may not be able to run the first script download-suttas.R because you need to use a Github personal access token to get more API calls. (Open to learning better software development practices to make scripts more reproducible!)

This book is a great starting point for learning how to use tidytext and the like.

Let me know what you think. Having a community of dhamma friends is a great motivator for me to keep on track with my sutta visualization projects!

I’d love to know if anyone else has been playing around with R or Python or anything else in this space.

3 Likes

That looks cool! I will have a play with it when I get time.

Ta mate,

J.R.

1 Like

Thank you so much for doing this! I use R professionally and have wanted to do projects on the sutta text for some time, but it being a side project I basically always just ended up stopping at the point of decoding the sutta central git organizational structure.

Also just FYI you don’t need to be logged into github to just download the files in this repo.

1 Like

I just had a look. You’ve already created a fantastic data set that’s fun to play with. Well done!

I wasn’t able to run the download script since my calls_remaining was only 60 rather than 72.

1 Like

I have more datasets that I’d like to add to the collection, and I’m thinking that maybe I should restructure the repo to make the data, scripts, and (possibly in the future) models and visualisations more accessible.

Right now there are 2 folders - data for the datasets and scripts for the scripts that produced them. I was thinking of getting rid of the scripts folder and having subfolders within data like dataset_1, dataset_2 etc. Each dataset_x folder would have it’s own dataset in multiple formats (.Rda, .tsv) etc. as well as the scripts that produced them. Then in the readme file I can have a description of what each dataset_x folder contains.

Does that make sense? What are your thoughts @Jhanarato @anon15117020?

That seems reasonable. A good project structure would make life easier for those who want to tinker. Even easier would be to have a package that can be imported. I’ve not created an R package but it should be easy enough. There’s a freely available book on the subject.

Also, have a look at Julia Silge’s take on the NBER papers. The data is not dissimilar to what you’ve produced.

Metta,

J.R.

I’m curious what kinds of insights (with a small i) you all hope to find from this kind of analysis.

To be honest I’m not sure where this will lead, I’m just following a gut feeling that it will lead somewhere interesting.

People might be interested in engaging with Buddhist content differently. Whether that is through “analyses” as you mention, or building creative content that allows people to engage with Buddhism from a different angle, or exploring the suttas with R/Python/Julia for their own enjoyment or whatever, the primary requirement is data. Luckily the data is all open-source. :pray:

But it’s not in a well-structured format, so anyone who wants to build off this data has to first clean it. There are clearly people who have wanted to play with the data (eg MinotaurWarrior) but have given up because they had to go through that painstaking process of preparing it first.

So I’m hoping that by doing that hard work for them, they can jump straight into the fun part (because it’s always the data prep that’s the boring part). When that happens, who knows, maybe when we see people expressing their creativity in ways we hadn’t conceived of before it will spark our own creativity and we can build off each others ideas?

Or maybe us Buddhists are just a dull bunch… :stuck_out_tongue: :man_shrugging:

1 Like

But that way it wouldn’t be accessible to people who wanted to use a different language.

One package to import & tidy and 1 or more with a data set?

Tidy, tidy, tidy!

Sometimes frustrating yes, but there’s nothing like a tidy tibble once you’re done. I’d also think that different languages may pose different problems. I wouldn’t know how to tidy Pali for instance. But yeah, in the end there’s a lot of people who enjoy the #TidyTuesday challenges so you may serve that market.

I’m still teaching myself R when I have time. I’ve also got a monastery to run. :slight_smile:

1 Like

By different languages I meant different programming languages… If the datasets are bundled into an R package they’d only be accessible to R users… Right?

Anything is possible. You can use rpy2 to run R code inside of python code or reticulate to do the opposite. You can also just have the R package available as well as the data files available separately.

I’d really just recommend doing what’s easiest for you.

Speaking for myself - honestly I just see this as a good corpus upon which to do an open-ended exploration of available techniques. I’m abstractly fascinated by NPL but I’m just not intrinsically curious about the typical use-cases shown in tutorials (Early 20th Century / late 19th century literature, and marketing / brand management).

Here’s a really trivial example - basically me just plugging the dataset in to the example code provided on the tidytext home page

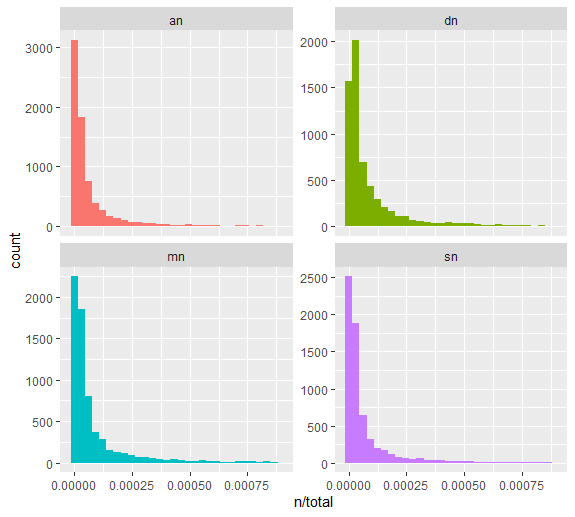
This is a basic sentiment analysis of the four nikayas across their “discourse number” (which for the AN is the number it’s the book of, e.g. the book of ones is discourse number 1)

Well, having read the AN, I immediately recognize why it has the greatest range in this measure of sentiment. Each “discourse” of the AN is just way longer than each “discourse” of the MN as this data set defines it. So the more interesting measure isn’t net sentiment but percentage positive sentiment.

So, here we see that sentiment is fairly even throughout the AN (hovering at around 50%, probably because the AN is exhaustive in trying to say everything in both the positive and negative form), and there’s some interesting patterns in the other nikayas. What’s that one spike in SN? My guess before looking it up is that it’s the inventory of the chief followers excellent qualities. Turn’s out I’m wrong - it’s SN34, the section on absorption. Interesting!

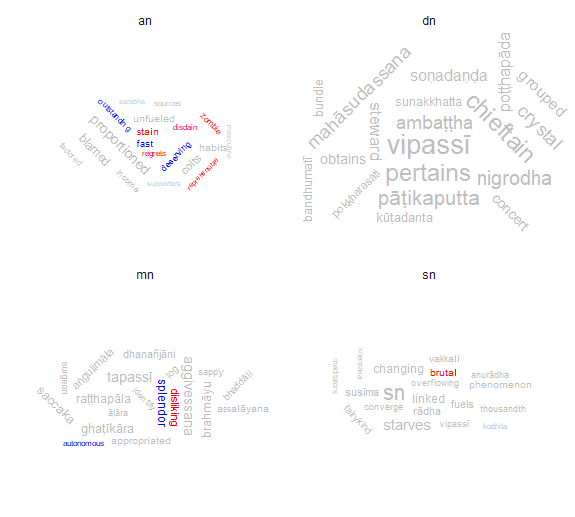
Here’s a messy graph of the comparison of word frequencies between the MN and DN, showing only words which are at least 0.01% of all the words in at least one nikaya.

So, we see overall a great deal of similarity. It looks like the word that’s most characteristic of the MN is “element” and the word that’s most characteristic of the DN is “sacrifice”. Huh.

This is all basic as can be, but personally I just find it intrinsically interesting.

3 Likes

Aha! We have our first plot, yay!

So, the joy of R is learning an entirely new set of jargon. I had to look up “sentiment analysis”:

Nice work! I’m no scholar but I’m sure there will be differences turning up between the EBTs and later work. There may be features of “interesting suttas” that turn up in other texts.

A slightly more interesting chart, these word clouds show the top 20 words in each sutta by "Term Frequency - Inverse Document Frequency" which is basically a measure of words that are common in a source and uncommon in others. These words are then colored by sentiment. The size of the words is proportional to this tf-idf measure.

A major feature of these clouds are proper nouns, unsurprisingly. If anything, it’s interesting there’s so few proper nouns. It shows the nikayas have a small, overall consistent set of settings and characters.

Also you’ll notice that the overall “size” of the DN cloud is the biggest, followed by the MN, followed by the SN and AN. The DN has words that are more unique to it than the other nikayas.

A few of these words are possibly more doctrinally significant. For example, it looks like the sappy log metaphor is more of a MN thing. “fuels” and “unfueled” are somewhat peculiar to the AN and SN respectively. But overall, there’s nothing huge that jumps out.

One other plot

shows the distribution of unique words by their frequency in the text. The typical pattern is what we see in the AN, MN, and SN - there’s a ton of words that appear very infrequently, very few words that appear very frequently, and a sharp downwards curve in-between. It’s extremely odd that DN doesn’t follow this pattern.

One thing I checked but won’t share, because there’s just too many charts, is the discourse-by-discourse version of the above chart for the DN. It largely shows the usual pattern, so my guess is that the odd pattern in the DN is somehow the restult of how it’s aggregated.

1 Like

Woohoo! Restructured the repo and added another dataset, check it out. :slight_smile:

Sutta blurbs this time!