SuttaCentral traffic

According to Cloudflare, we served 170 GB of bandwidth in November, with the following traffic count. I’m not really sure what this is counting, I guess it’s the number of hits.

  • United States: 3,939,201
  • Australia: 1,077,972
  • Sri Lanka: 756,021
  • India: 706,598
  • Other: 7,562,785

I don’t really pay much attention to metrics, I’d rather focus on just building a great site: quality trumps quantity. But it’s nice to know people are using SC!

20 Likes

Thank you for sharing, Bhante. Do you know if this includes discourse as well?

Am I correct that you don’t collect any stats through a tracking service?

3 Likes

I think this is just the main SC. We have Google Analytics, but I haven’t checked it for ages. I’d rather get rid of it.

5 Likes

That is one of the questions I have as well. I’ll try to track down some answers regarding the stats reports, and exactly what is being measured. Such as, if it is SC alone and Discourse alone or if they are combined.

3 Likes

Discourse has its own metrics built-in (it can be accessed at admin/dashboard/reports) and it offers a wide range of insights into the forum usage. There are tabular and graph views available, and data export as well, so I hope you will find what you are looking for.

There is also a large discrepancy between internal metrics data and Google Analytics reported by some users, and the reasons behind it are various: Why there is huge difference in Pageviews tracking number on discourse admin dahboard and on google analytics - support - Discourse Meta, Smarter handling of random crawler traffic - feature - Discourse Meta and the number of people who are concerned with internet privacy is also increasing and they will block analytics and more along with ads, which will skew results based on client side gathering (personally, I highly recommend uBlock Origin which is very light, supported on most browsers and not only blocks ads but can also filter all sort of malware, trackers, social plugins and analytics).

8 Likes

I have a ‘dummies 101’ level question please :upside_down_face:

Does the dashboard we use for discourse (image above) only cover the forum discourse.suttacentral.net or does it include stats from the main Sutta Central suttacentral.net site as well?

If not, can I get access to the stats of the Sutta central site?

I’d like to look at a few correlations across the two. (if possible)

2 Likes

yes

perhaps Bhante @sujato can grant you access to GA data for the main site?

Thank you, I just installed it in all browsers I am using. :smiley:

2 Likes

Looking at the Google Analytics data, here is some basic information. The time period is from 1 Dec 2018 to 30 Nov 2019.

One should be cautious as the data doesn’t always mean what it seems to mean. And some metrics are dodgy at best. For example time on page is notoriously useless. Also, I wouldn’t put complete confidence in the geo measurements as I think they come from server location more than actual user location.

Referral

I’m happy to see organic search is so high.
The following is the breakdown of the red slice above.

Notes:

  • The first column is for USERS, not page views. This is interesting when you compare the first column, users, with the third column, sessions. Even though the discourse referrals is only 3k users, it represents 26k sessions. This shouldn’t be surprising.
  • Likewise, it’s not surprising that most FB users were new, and that they don’t have much more than a single session each. This could indicate that when a new user comes to the site, they don’t really know how to stay on the site. On the other hand, if they got there because of a specific page, they may not have much interest to explore further. But it could mean that the wealth of material on the site is not apparent. Perhaps having a gently triggered popup for first time visitors to explain the site might increase their exploration.
  • the m. in the Facebook and Wikipedia url’s indicate mobile. The l. in the FB link indicates that they were referred through a link.

Location

Again, this is Users for 1 Dec 2018 to 30 Nov 2019

For just November, the period given by Bhante in the OP, this is what GA has:

Back to the one-year data, here it is by city:

Since Sri Lanka has the highest city, I decided to look at pages for Sri Lanka:


This isn’t really surprising since I believe there is a complete Sinhala translation on the site. BTW, GA does detect the suburbs around Colombo as distinct places, so this really is about Colombo.

Pages

Again, this is one-year data:

Not at all surprising that MN 10 and 118 are in the top 15. I’m surprised that DN 1 is. Could it be that so many people believe in starting from the top? I hope not.

It’s interesting that /offline is so popular. It’s a good reminder that the most serious users probably aren’t included in these stats.

One obvious outlier is DN 30, Lakkhana Sutta, in Indonesian language. It’s consistent through the year, with a small spike…


I’m by no means an expert at GA, but if anyone had questions I would try and figure them out. I can also post spreadsheets of larger data sets.

10 Likes

This is really great ! Many Thanks :smiley:

2 Likes

Some other notes…

  • Google Analytics (GA) is not used for discourse.
  • GA is also not used in the legacy. site

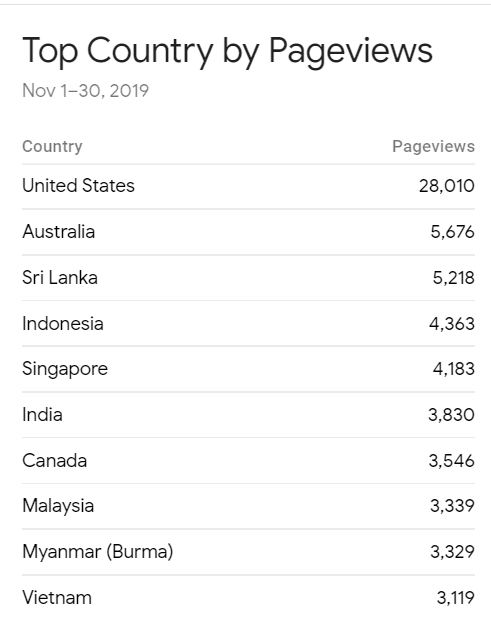
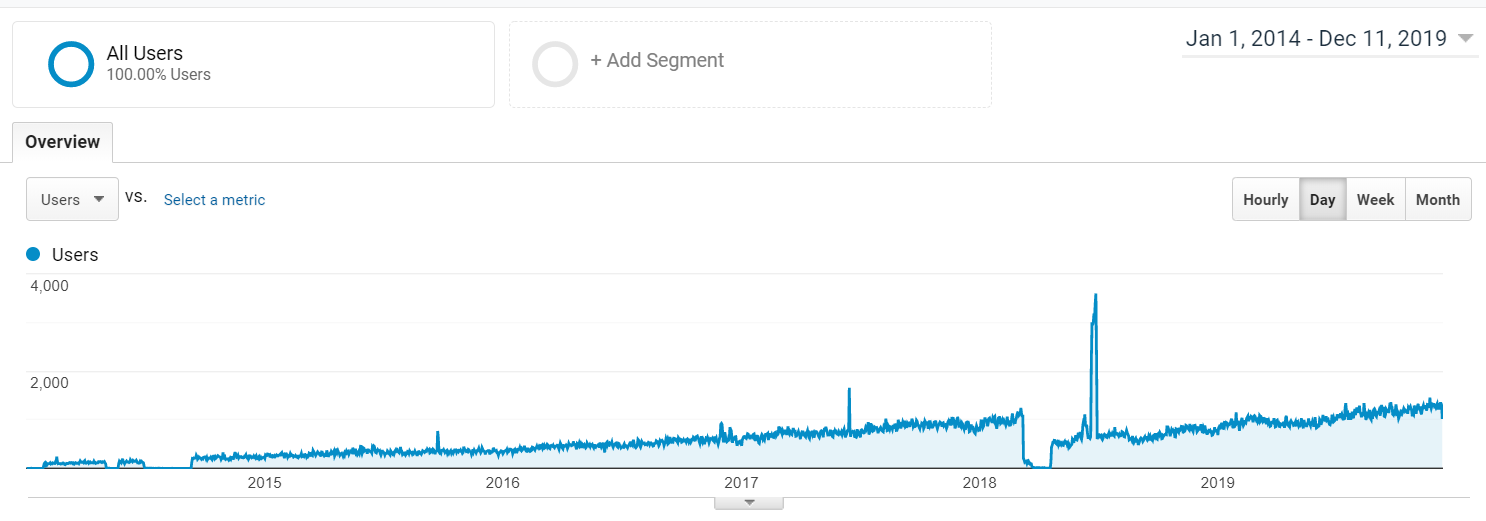
If you look at all the stats from back to 2014, you can see that there is a big change from the old site to the new… This is page views.

When I casually compare Jan 2018 (old site) with Nov 2018 (new site) it appears that the drastic difference is due to the structure of the site. In the old site you were required to navigate through a series of pages to get to the sutta you wanted (for example /sn, /sn56, finally /en/sn56.11)


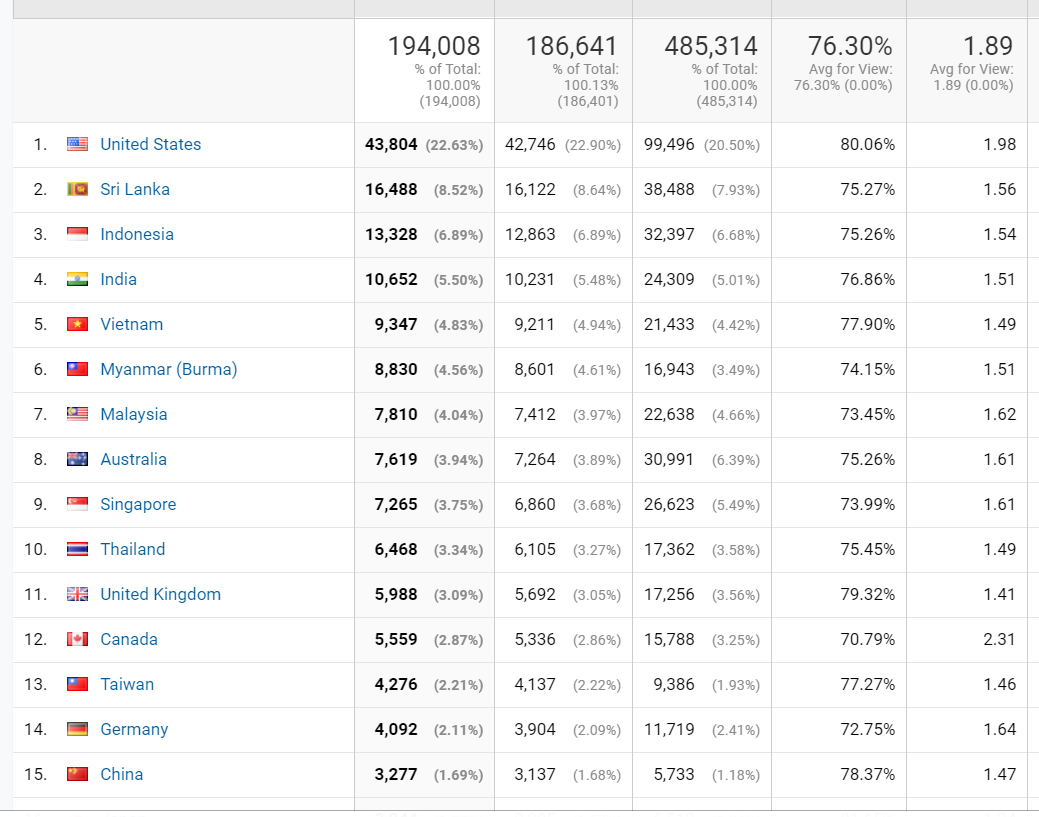
Looking at USERS, it doesn’t show nearly as drastic a difference. Users is probably also a dodgy metric, not to be trusted too much.

Wondering about that spike in June 2018? Me too. It comes from about one week where a huge number of users accessed about 10 specific pages from the Chinese Vinaya. Most of them were “direct” meaning Google can’t give a referrer. And most users only had one or two page views. I’m guessing there was a class somewhere? about 80% of the users from that period were from the USA.

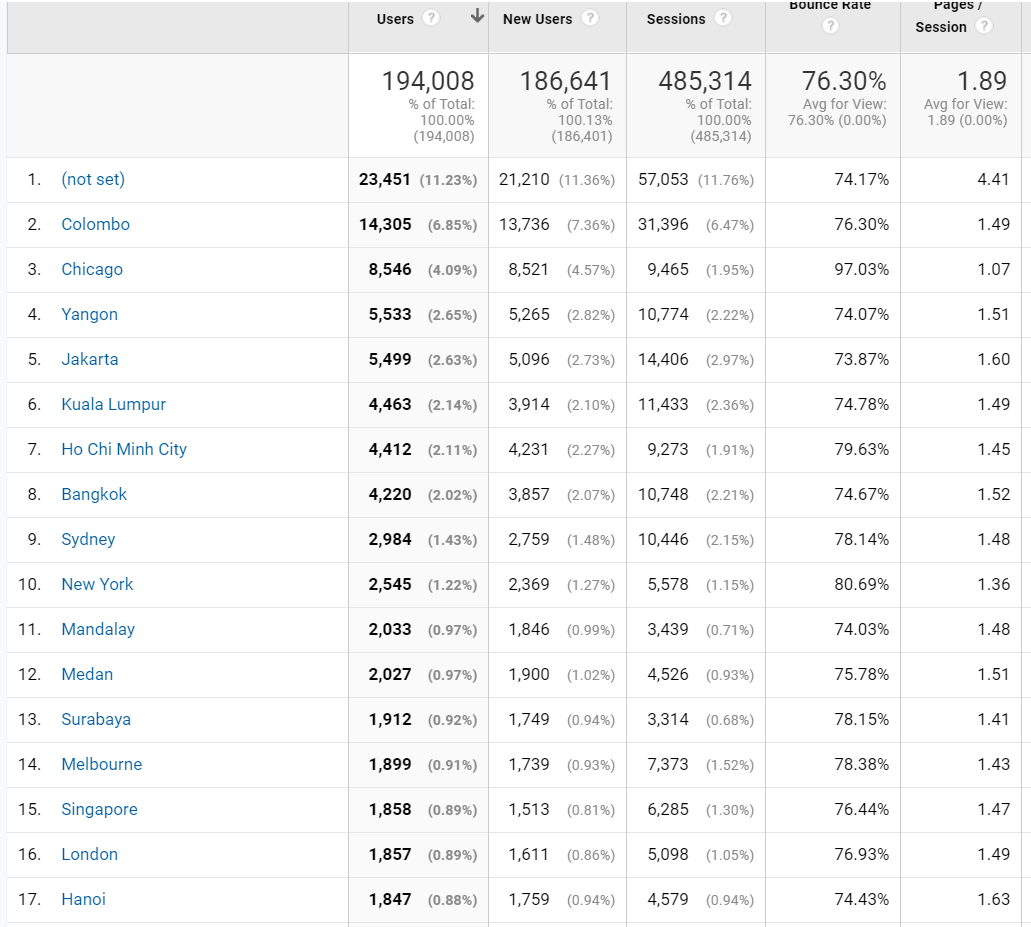
EDIT: OK, I kept poking. The specific time for the spike is 21-29 June 2018. For that week 84% of the total users (21,111) came from Boardman, Oregon, USA. Funny thing is, there are only 3,405 residents. No Buddhist temples. Mormon, but not Buddhist.

Looking at the Network Domain, almost 95% of those are… amazonaws.com. Any ideas how that works?

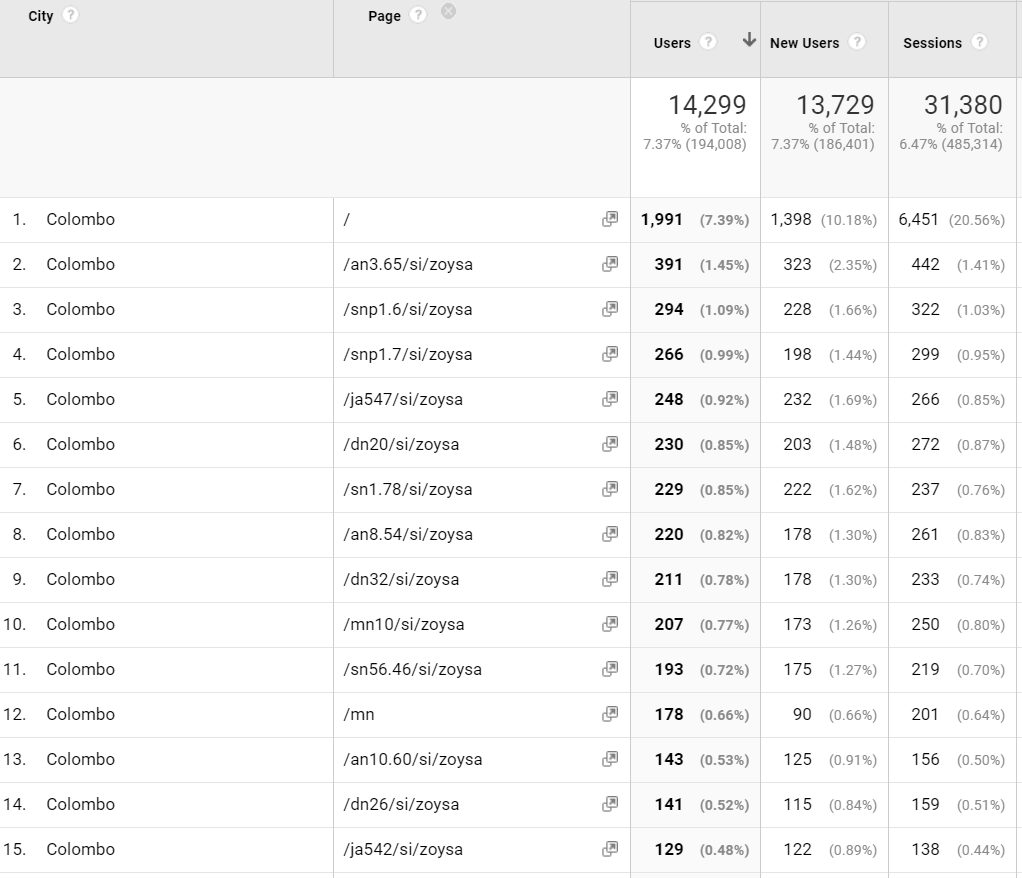
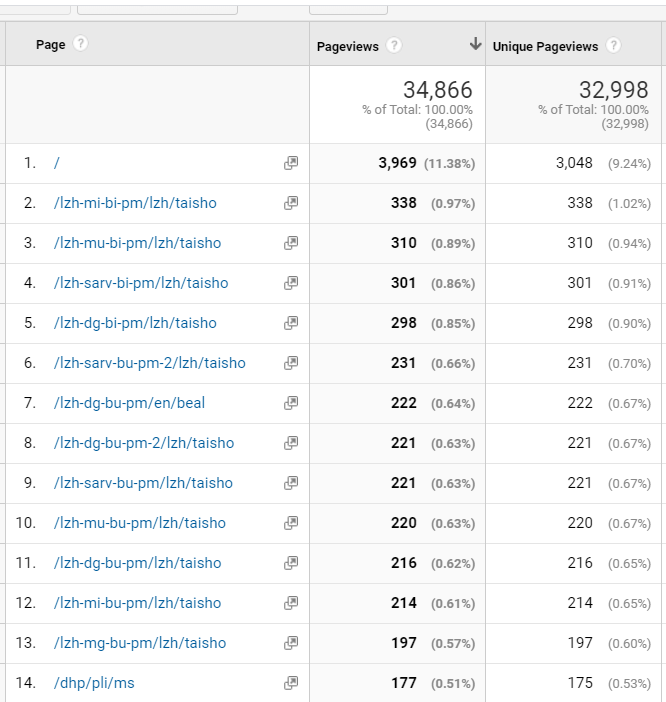
And what pages were the unsuspecting townsfolk of Boardman facilitating…

Another clue is that for those pages, Page Views and Unique Pageviews are identical. That’s odd. It makes me think that there aren’t humans looking at those pages. Otherwise at least one person would have clicked refresh sometime in that week.

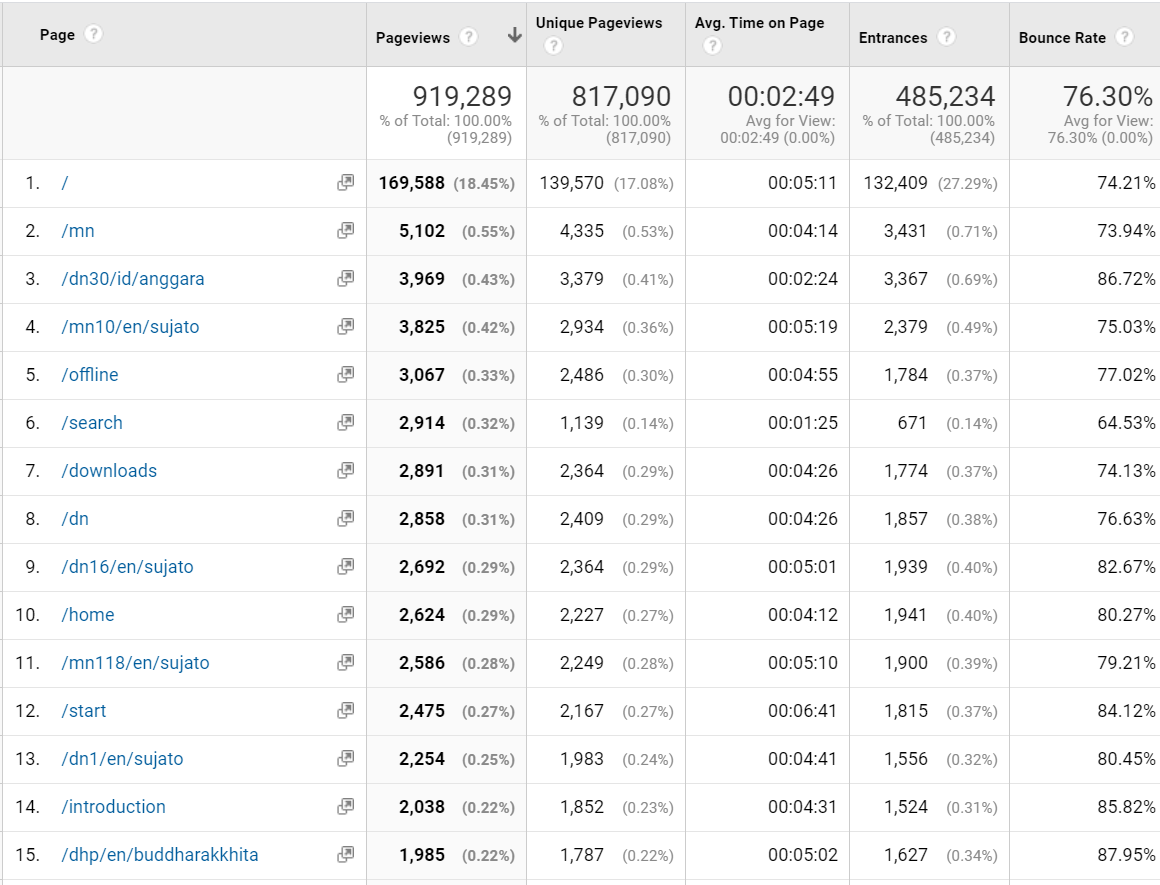
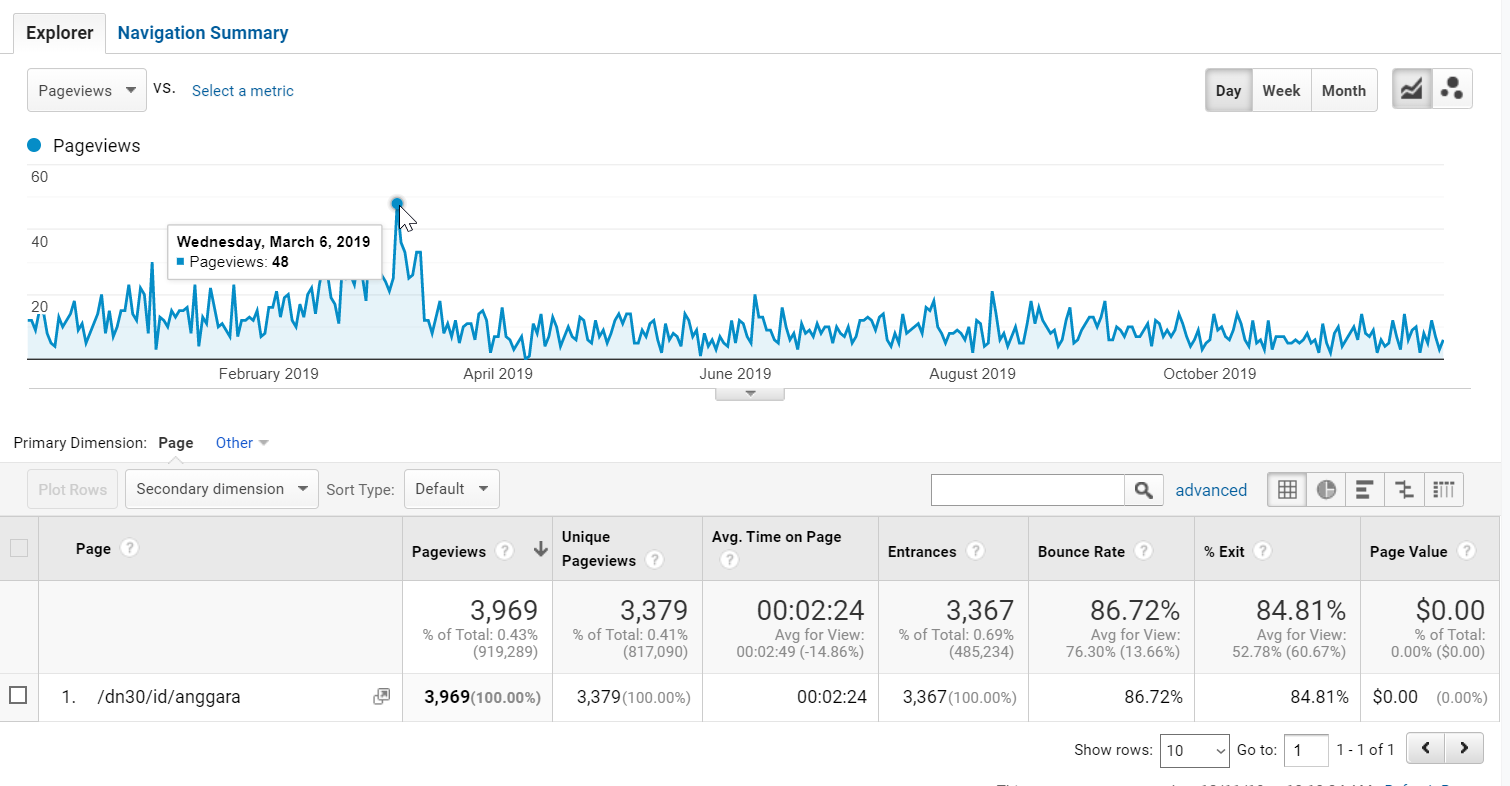
The rest of the pages for that period look like what the general page views tend to be, including the yet unsolved popularity of the Indonesian translation of DN 30 (75 page views).

Looking at acquisition…


100% are direct
100% bounce rate
1 page per session
00:00:00 Avg. Session Duration.

Must be a computer. But why? So strange. Any ideas?

8 Likes

Voice is hosted in AWS western region (OR, CA) and was probably hammering SuttaCentral for suttas?

2 Likes

No, if you check the whole post you can see that these were only 13 pages, all in Chinese.

2 Likes

@snowbird and others :slight_smile:
Where can I find the overall number of members. Rather than daily users or log ins. I’m interested in the whole membership, and how that has increased, decreased, changed. And if possible to look at a breakdown of those figures via
male/female/unknown
country
length of membership
amount of activity/type of activity.

With SC, there is no sign up for membership right? So I’m assuming the only count one can get is about log in’s and page views.

I would love to do a bit of analysis and to find out if the user groups are quite discreet or if there is significant overlap. If there were a sign up to SC, then one could compare to see in which direction people are going - forum to SC or SC to forum…

3 Likes

So, Google Analytics (GA) is not installed in Discourse, so as far as the forum goes you have to investigate in that software.

GA, in fact, can give you what many people consider to be an unethical amount of information about your traffic. Not really about individuals so much though. Were you asking about Discourse or SC?

In the chart further up the thread you can see referrers. Those are what sent people to SC. As far as I can tell, the opposite information (where they went to from SC, i.e. discourse, is not tracked. It is possible to code in link tracking, but I’ve never done it. As I understand it, the way someone gets from SC to discourse is by being in a sutta, clicking on the three dot menu icon, scrolling down, and clicking on the Discuss link. I don’t know if a tracking code could be added to that. But it would probably be easier to find the referrer stats in the discourse software.

1 Like

Many thanks for your help. I’ve started a query in Discourse to see if there is access to more information permutations than available via dashboard.

It’s a little frustrating that SC and Discourse are different systems (I always thought of them as different rooms in one house). Because from a conceptual and organisational perspective they are both supporting the same goal, it would be great to get some cross over stats… but it looks like this is impossible. No worries :smiley: one less thing to do. Just some conditioning to check performance against aims and goals… :rofl:

1 Like

Right, I have been directed via Discourse to a plug-in for discourse that would allow us to extract more info from our usage stats, here

Apologies, but I have no idea what a plug-in is or how to do it etc etc - so this is up to all you tech gurus :smiley: @sujato @snowbird @karl_lew

I 'm happy to learn and use it once it is set up, but my computer knowledge froze in about 2000 except for using excel and word …

Added here is the link to the discussion on Discourse. I am V for Viveka …

Basically I’d like to correlate user demographics x usage stats, to give us an idea of who is and who isn’t using the site and in what ways. It may just be something I do as little project… I can even do a manual transport of member page and profile info into an excel spread sheet, If there is a way to access the full member list, not just active members through dashboard - or am I missing something. I can get access to the number of sign up for specified durations eg the last 3 years 1.1k of people have signed up, but this isn’t linked to specific user information.

2 Likes

Ok I have found that the search capacity we have through dashboard, can’t link into any of the custom fields that we have created in the sign up page.

But if we get the plug in then we can include all those fields in our search results.

It comes down to whether Bhante feels that the benefits are worth the hassle. Over the next week or so, I’ll put together a list of the types of information that we could get, would like to get, so that the discussion can be more targetted and exact.

FYI I’m currently working on a little stats overview to be posted … is looking quite interesting :slight_smile:

2 Likes

The other thing that is really good to see is that (if we take out m.facebook) then the greatest source of referrals was Discourse, followed by Dhamawheel, and then the others.

Also there were many more sessions per those referred from Discourse at 25.96% of the total - the rest being spread over 15 other sources. This looks like people are online and moving between SC and DIscourse… Nice

Also funny to notice BSWA’s traffic and usage :smiling_imp: at 4 sessions per user… mischieviously compared to Discourse at 8 sessions per user :grin:

Gotta love stats :upside_down_face:

3 Likes

Considering that SC doesn’t have its own facebook page, I think it’s astounding how much traffic it generates. And as I said in a comment in the thread, it would be nice if we could figure out how to keep those facebook referrals on the site (to more pages) for longer.

Now here is something you might want to look at. It is referrer as primary dimension and landing page as secondary dimension. Remember that all the facebook referrers are basically the same.
Analytics All Web Site Data Referral Traffic 20190101-20190630.zip (196.2 KB)

3 Likes