The Pali language, as every other language, has evolved over time. One of the changes that the language has undergone through the centuries is that words have become increasingly complex and words have merged together to form longer words. We would therefore expect that a statistical analysis of average word-length could be an indication of relative ”age” of the texts in question.
In this research I analyse the average word-length of each text and each book in the Pali canon to find trends in the canon and test the above hypothesis; to show that average word-length can be used as an indicator to show the development of the texts over time. Average word-length in itself remains only an indication of ”lateness” of texts, among other indications like the existence and quality of parallels, but nevertheless can prove a valueble resource in determining the development of the texts in the Pali canon and ultimately what the Buddha taught.
The attached PDF shows the entire draft study of 22 pages so here I will only give a short summary of it.
wordlength.zip (3.4 MB)
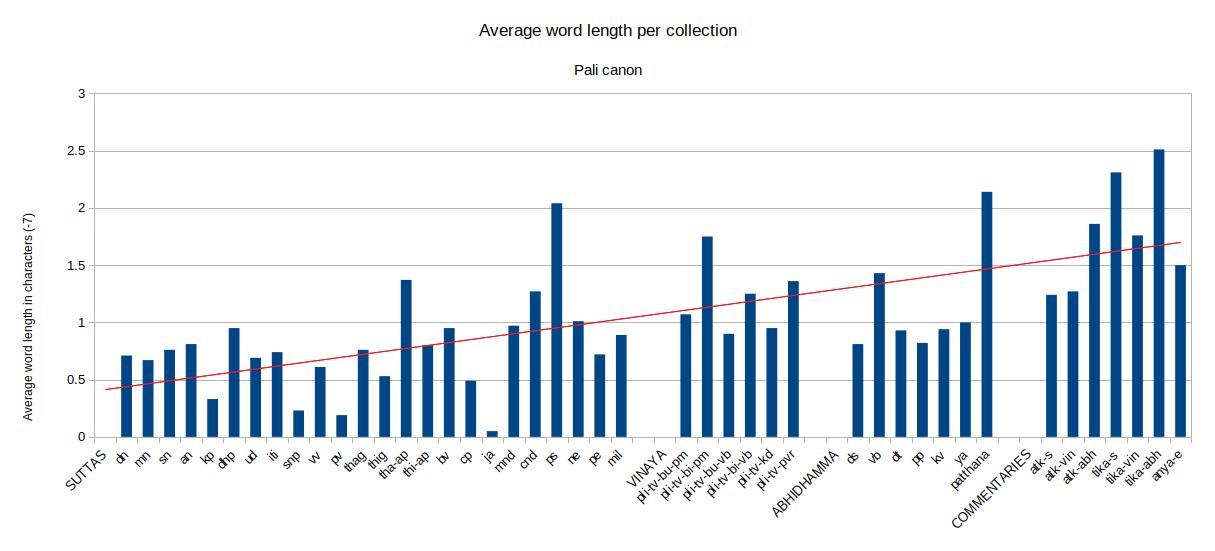
The first results in analyzing the average word length are shown below. Although the chart shows a definate upward trend, there are a few unexpected anomalies in the data, especially within the Dhammapada results, that made me question the causes of these discrepancies.
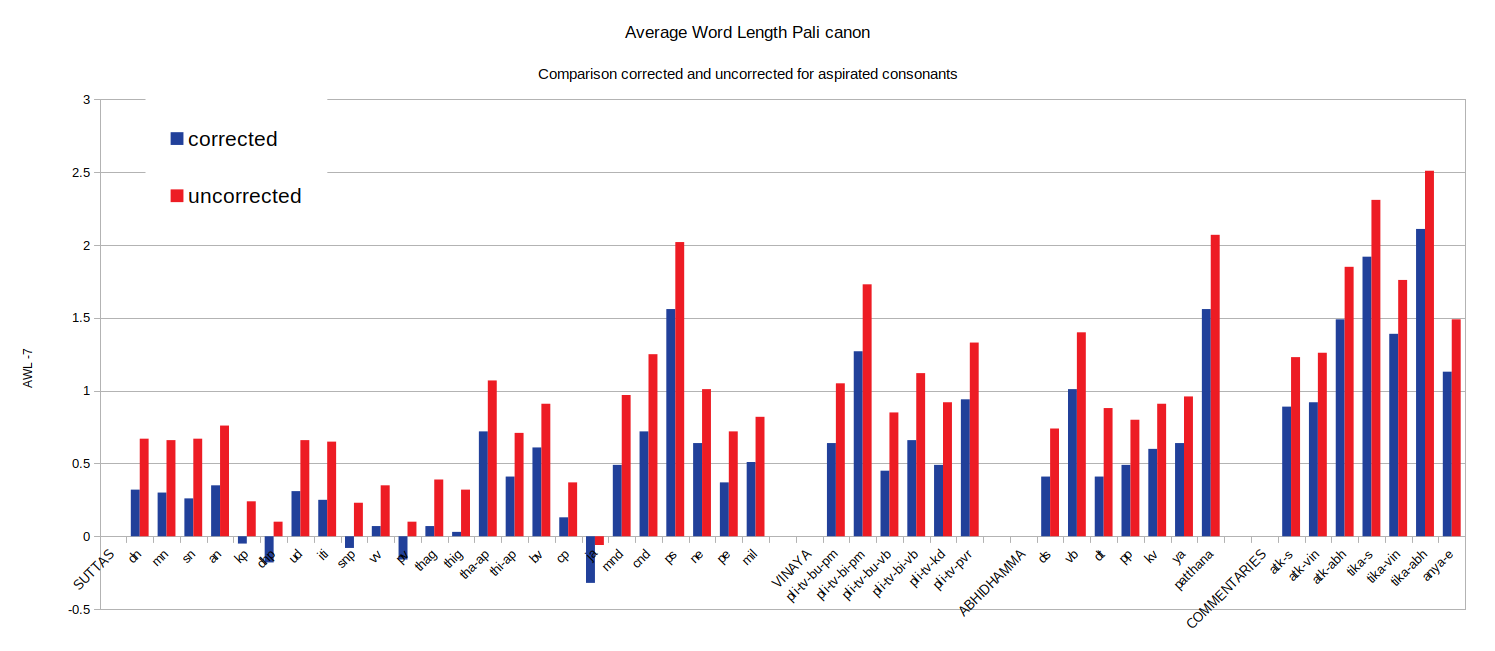
So I ran the algorithm again on a dataset that had the headers removed. The chart below shows both the old set (in blue) and the new set with headers removed (in red). It clearly shows that the value for the Dhammapada has suddenly decreased a lot. Not only that, but removing the headers seems to have a greater impact on earlier texts while it has hardly any impact on the commentaries. Headers were only added to the texts at the time these were written down and therefore reflect the time and use of language of that time rather than the text they are referring to. In other words, headers are later inclusions and this shows in the data.

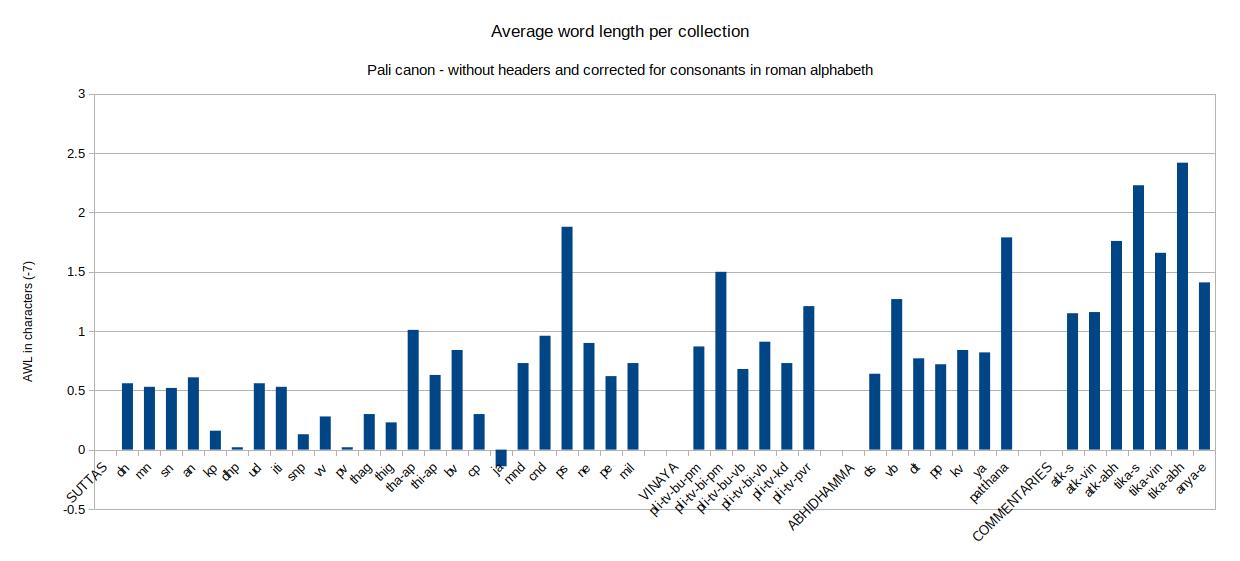
And this is the same chart with the 0-axis moved up so all collections that we currently know as “early” give a negative value.

The other thing I noticed is the relatively low values for verse as opposed to prose texts. I expand a little bit more on this in the study.
I also look in more detail at the Jataka collections. Although at first glance you can argue that these are pre-Buddhist texts and therefore even earlier with lower average word lenght, which might indeed be the case, the distribution of the Average Word Length within the collection itself also shows an interesting trend.
The study also shows charts and sankey-graphs for some of the collections and compares them with known parallels data across languages for a better understanding.
In the study I briefly touch upon the ratio calculations to show the impact of individual files on the total average word length of the collections and the spread therein.
Conclusion
Analysing the Pali canon based on average word length (AWL), corrected for abbreviations and without headers, shows that the AWL is a reliable indicator for lateness of collections and the Pali canon shows a clear trend in use of language across time. The clear impact of headers on the values shows that these have been added at a later date. Verse collections as well as mātikā have a relatively lower AWL than prose of roughly the same age.
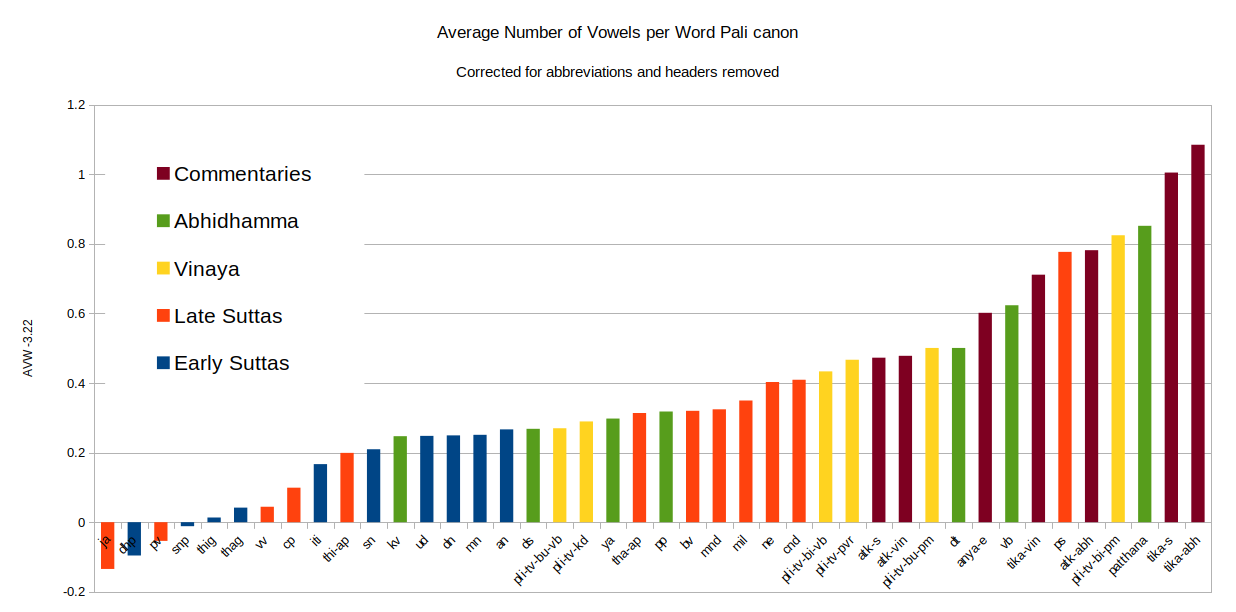
The following graph shows the Average Word Length sorted by value and color-coded to show that early suttas have an overall lower AWL while commentaries have an overall very high AWL. It also shows that as a general trend the Vinaya, Abhidhamma and later suttas have all developed around the same time.

However, we have to be careful when using the AWL for files within collections because these can show considerable variations based on several factors, especially if files are very short. The AWL is only an indicator, which can be used together with other indicators like f.i. the number and quality of parallels, especially parallels with other canons from other schools.
Feedback
I would very much welcome your feedback on this study, especially on the anomalies that are observed. If needed, I can also try to make different charts or show different sankey-graphs or do different calculations on the data so if you have a good idea on this, please let me know.